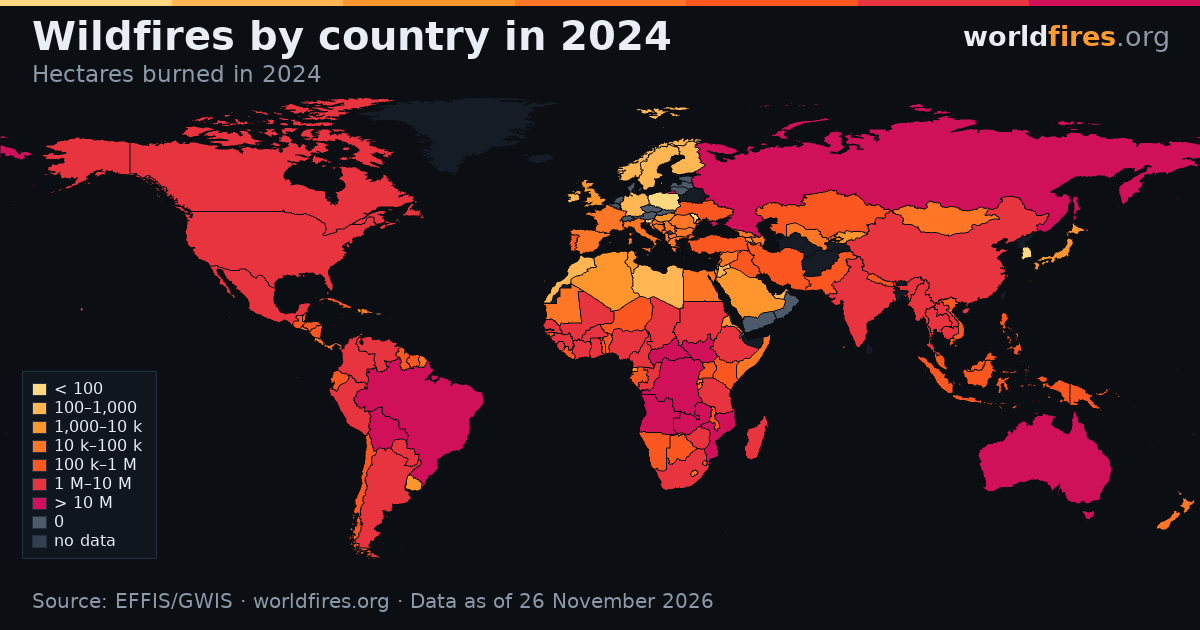
Wildfires by country in 2024
In 2024, Brazil had the largest burned area (41,259,349 ha) of the 133 countries with data, which together burned 352,722,594 ha according to the official EFFIS, GWIS and national series.
Top 30 · 2024
- 1 Brazil 41.3 M ha
- 2 Democratic Republic of the Congo 37.8 M ha
- 3 Angola 34.3 M ha
- 4 Australia 30.4 M ha
- 5 South Sudan 19.6 M ha
- 6 Bolivia 16.5 M ha
- 7 Zambia 16.2 M ha
- 8 Mozambique 14.0 M ha
- 9 Russia 12.3 M ha
- 10 Central African Republic 11.6 M ha
- 11 Venezuela 6.8 M ha
- 12 Tanzania 6.3 M ha
- 13 Nigeria 5.7 M ha
- 14 Guinea 5.3 M ha
- 15 Myanmar 5.3 M ha
- 16 Canada 5.2 M ha
- 17 United States 4.3 M ha
- 18 Ghana 4.1 M ha
- 19 Mexico 4.0 M ha
- 20 India 3.9 M ha
- 21 Madagascar 3.9 M ha
- 22 Mali 3.6 M ha
- 23 Sudan 3.5 M ha
- 24 Chad 3.5 M ha
- 25 Ethiopia 3.3 M ha
- 26 Laos 3.2 M ha
- 27 South Africa 3.1 M ha
- 28 China 2.7 M ha
- 29 Argentina 2.7 M ha
- 30 Paraguay 2.7 M ha
- Countries
- 141
- Fires with a page
- 130,798
- Hectares on pages
- 730.2 M ha
- Active now
- 1,472
Fire, country by country
Hover over (or tap) a country to see its figures; click to open its page. Yearly average and current year from Copernicus national estimates (EFFIS in Europe, GWIS elsewhere) or national agencies where available.
Most burned in 2026
Hectares burned this year according to national estimates, up to the latest published week, and the difference with the average for that same week.
-
1
 Democratic Republic of the Congo22.4 M ha
▼ 46 %
-
2
 Angola18.7 M ha
▼ 46 %
-
3
 Australia18.1 M ha
▼ 29 %
-
4
 Brazil10.7 M ha
▼ 60 %
-
5
 Zambia10.7 M ha
▼ 47 %
-
6
 Mozambique8.6 M ha
▼ 46 %
-
7
 Indonesia8.3 M ha
▲ 160 %
-
8
 Russia7.7 M ha
▼ 45 %
-
9
 South Sudan7.5 M ha
▼ 23 %
-
10
 Central African Republic6.0 M ha
▼ 34 %
Compare countries
Hectares burned each year according to each country’s annual series (official or GWIS). Hover over the chart to see the figures.
Pick one or more countries to compare them.
-
8,217fires with a page131.2 Mha on pages2023Worst year2016ha burned per year2026
2026: 18,093,129 ha ▼ 29% below average
Largest fire Lithgow fire, October 2019 · 855,014 ha -
8,562fires with a page73.4 Mha on pages2024Worst year2016ha burned per year2026
2026: 10,661,394 ha ▼ 60% below average
Largest fire Barão de Melgaço fire, 13 July 2020 · 801,620 ha -
5,453fires with a page62.2 Mha on pages2021Worst year2016ha burned per year2026
2026: 7,685,106 ha ▼ 45% below average
Largest fire Gorny Ulus fire, 22 June 2021 · 1,009,567 ha -
3,170fires with a page38.8 Mha on pages2023Worst year2016ha burned per year2026
2026: 2,631,351 ha ▼ 35% below average
Largest fire Eeyou Istchee Baie-James fire, May 2023 · 976,263 ha -
4,766fires with a page27.8 Mha on pages2020Worst year2016ha burned per year2026
2026: 3,437,518 ha ▼ 29% below average
Largest fire August Complex, August 2020 · 432,192 ha -
1,904fires with a page26.2 Mha on pages2024Worst year2016ha burned per year2026
2026: 1,427,535 ha ▼ 74% below average
Largest fire San Ignacio fire, 18 June 2024 · 4,468,196 ha -
2,004fires with a page25.9 Mha on pages2016Worst year2016ha burned per year2026
2026: 7,530,513 ha ▼ 23% below average
Largest fire Wau fire, 27 November 2016 · 742,600 ha -
2,807fires with a page24.5 Mha on pages2016Worst year2016ha burned per year2026
2026: 10,650,540 ha ▼ 47% below average
Largest fire Chipili fire, July 2026 · 614,688 ha -
1,143fires with a page20.4 Mha on pages2016Worst year2016ha burned per year2026
2026: 6,032,709 ha ▼ 34% below average
Largest fire Yalinga fire, 24 December 2020 · 979,715 ha -
2,578fires with a page19.9 Mha on pages2019Worst year2016ha burned per year2026
2026: 8,590,456 ha ▼ 46% below average
Largest fire Mocuba fire, 16 August 2026 · 505,288 ha -
1,965fires with a page19.7 Mha on pages2019Worst year2016ha burned per year2026
2026: 18,658,275 ha ▼ 46% below average
Largest fire Capenda-Camulemba fire, 17 July 2026 · 211,891 ha -
1,752fires with a page18.8 Mha on pages2016Worst year2016ha burned per year2026
2026: 22,427,734 ha ▼ 46% below average
Largest fire Bulungu fire, 27 July 2026 · 305,095 ha -
2,021fires with a page13.7 Mha on pages2021Worst year2016ha burned per year2026
2026: 635,455 ha ▼ 65% below average
Largest fire Ngamiland West fire, 19 August 2021 · 159,584 ha -
2,779fires with a page11.0 Mha on pages2020Worst year2016ha burned per year2026
2026: 1,024,840 ha ▼ 71% below average
Largest fire Caleu Caleu fire, 25 December 2016 · 231,424 ha -
1,850fires with a page10.1 Mha on pages2019Worst year2016ha burned per year2026
2026: 8,294,856 ha ▲ 160% above average
Largest fire Seruyan fire, 9 August 2026 · 345,169 ha -
2,829fires with a page10.0 Mha on pages2019Worst year2016ha burned per year2026
2026: 1,343,655 ha ▼ 68% below average
Largest fire Madera fire, April 2025 · 51,926 ha -
2,062fires with a page9.7 Mha on pages2020Worst year2016ha burned per year2026
2026: 4,326,433 ha ▼ 33% below average
Largest fire Paletwa fire, 6 April 2023 · 145,898 ha -
1,963fires with a page9.1 Mha on pages2016Worst year2016ha burned per year2026
2026: 2,025,275 ha ▼ 51% below average
Largest fire Jore fire, January 2022 · 201,499 ha -
3,186fires with a page9.0 Mha on pages2020Worst year2016ha burned per year2026
2026: 2,671,281 ha ▲ 15% above average
Largest fire Mae La Noi fire, 19 March 2026 · 160,413 ha -
1,327fires with a page8.7 Mha on pages2016Worst year2016ha burned per year2026
2026: 3,379,759 ha ▼ 59% below average
Largest fire Mbarali fire, 4 September 2021 · 140,758 ha -
3,457fires with a page8.5 Mha on pages2017Worst year2016ha burned per year2026
2026: 2,498,643 ha ▲ 5% above average
Largest fire Hulan District fire, 17 March 2026 · 118,357 ha -
2,565fires with a page7.6 Mha on pages2020Worst year2016ha burned per year2026
2026: 3,124,116 ha ▼ 24% below average
Largest fire Sucre fire, 3 April 2024 · 45,916 ha -
2,106fires with a page7.6 Mha on pages2020Worst year2016ha burned per year2026
2026: 754,841 ha ▼ 70% below average
Largest fire Bahía Negra fire, 2 September 2024 · 205,039 ha -
1,805fires with a page7.5 Mha on pages2016Worst year2016ha burned per year2026
2026: 2,933,327 ha ▼ 28% below average
Largest fire Kontagora fire, 25 December 2025 · 94,992 ha -
1,195fires with a page7.0 Mha on pages2021Worst year2016ha burned per year2026
2026: 877,544 ha ▼ 45% below average
Largest fire Outjo fire, 4 September 2026 · 207,324 ha -
1,557fires with a page7.0 Mha on pages2023Worst year2016ha burned per year2026
2026: 2,642,326 ha ▼ 28% below average
Largest fire Phiang fire, 27 March 2026 · 113,987 ha -
1,721fires with a page6.3 Mha on pages2016Worst year2016ha burned per year2026
2026: 1,391,496 ha ▼ 31% below average
Largest fire Kaya fire, 27 September 2016 · 57,635 ha -
1,640fires with a page6.2 Mha on pages2021Worst year2016ha burned per year2026
2026: 1,510,639 ha ▲ 6% above average
Largest fire Al Leri fire, 15 November 2021 · 88,958 ha -
2,901fires with a page5.9 Mha on pages2020Worst year2016ha burned per year2026
2026: 1,456,571 ha ▼ 34% below average
Largest fire Ngambé-Tikar fire, 14 February 2026 · 120,811 ha -
1,254fires with a page5.7 Mha on pages2020Worst year2016ha burned per year2026
2026: 1,764,975 ha ▼ 12% below average
Largest fire Sene East fire, January 2020 · 127,027 ha -
1,324fires with a page5.6 Mha on pages2021Worst year2016ha burned per year2026
2026: 1,496,411 ha ▼ 50% below average
Largest fire George fire, 25 October 2018 · 60,338 ha -
2,416fires with a page5.4 Mha on pages2022Worst year2016ha burned per year2026
2026: 921,101 ha ▼ 56% below average
Largest fire Lupane fire, 29 August 2022 · 66,275 ha -
2,228fires with a page5.1 Mha on pages2024Worst year2016ha burned per year2026
2026: 574,160 ha ▲ 42% above average
Largest fire Dori fire, 18 October 2025 · 63,851 ha -
1,448fires with a page5.1 Mha on pages2016Worst year2016ha burned per year2026
2026: 3,253,360 ha ▼ 40% below average
Largest fire Albadariah fire, 7 January 2026 · 72,176 ha -
743fires with a page4.9 Mha on pages2017Worst year2016ha burned per year2026
2026: 692,390 ha ▼ 71% below average
Largest fire Ulytauskiy fire, 17 August 2017 · 76,097 ha -
354fires with a page4.1 Mha on pages2021Worst year2016ha burned per year2026
2026: 4,089,136 ha ▼ 25% below average
Largest fire Orchha fire, 3 April 2017 · 165,613 ha -
1,611fires with a page4.0 Mha on pages2016Worst year2016ha burned per year2026
2026: 452,194 ha ▼ 63% below average
Largest fire Parc national de la Comoé fire, 6 December 2018 · 90,945 ha -
1,198fires with a page3.5 Mha on pages2017Worst year2016ha burned per year2026
2026: 344,641 ha ▼ 30% below average
Largest fire Bassila fire, 7 January 2026 · 111,614 ha -
842fires with a page3.3 Mha on pages2023Worst year2016ha burned per year2026
2026: 1,209,862 ha ▼ 1% below average
Largest fire Missira fire, 10 January 2026 · 131,818 ha -
1,081fires with a page3.3 Mha on pages2020Worst year2016ha burned per year2026
2026: 1,028,873 ha ▼ 46% below average
Largest fire Puerto Gaitán fire, 7 January 2016 · 32,765 ha -
1,698fires with a page3.1 Mha on pages2016Worst year2016ha burned per year2026
2026: 675,860 ha ▼ 50% below average
Largest fire Kibanda fire, 2 January 2017 · 41,220 ha -
1,770fires with a page3.1 Mha on pages2019Worst year2016ha burned per year2026
2026: 731,535 ha ▼ 64% below average
Largest fire Sandor fire, 27 February 2019 · 24,116 ha -
868fires with a page3.0 Mha on pages2021Worst year2016ha burned per year2026
2026: 1,586,985 ha ▼ 7% below average
Largest fire Tessit fire, 19 October 2025 · 41,288 ha -
671fires with a page2.9 Mha on pages2016Worst year2016ha burned per year2026
2026: 1,528,387 ha ▼ 46% below average
Largest fire Chhaeb fire, 16 January 2026 · 84,354 ha -
597fires with a page2.3 Mha on pages2016Worst year2016ha burned per year2026
2026: 1,877,520 ha ▼ 45% below average
Largest fire Marovoay fire, September 2025 · 37,565 ha -
5,662fires with a page2.1 Mha on pages2024Worst year2016ha burned per year2026
2026: 437,324 ha
Largest fire Narodychi fire, 3 April 2020 · 45,987 ha -
732fires with a page1.9 Mha on pages2016Worst year2016ha burned per year2026
2026: 229,500 ha ▼ 66% below average
Largest fire Nkhata Bay fire, 16 October 2025 · 123,561 ha -
445fires with a page1.9 Mha on pages2017Worst year2016ha burned per year2026
2026: 311,979 ha ▼ 14% below average
Largest fire San Javier fire, January 2017 · 192,854 ha -
1,075fires with a page1.8 Mha on pages2016Worst year2016ha burned per year2026
2026: 1,054,707 ha ▼ 36% below average
Largest fire Divénié fire, 1 September 2026 · 19,735 ha -
824fires with a page1.7 Mha on pages2020Worst year2016ha burned per year2026
2026: 333,168 ha ▼ 57% below average
Largest fire Orica fire, 19 March 2020 · 63,428 ha -
938fires with a page1.4 Mha on pages2017Worst year2016ha burned per year2026
2026: 71,525 ha ▼ 32% below average
Largest fire Pombeiro da Beira fire, October 2017 · 132,830 ha -
1,303fires with a page1.4 Mha on pages2025Worst year2016ha burned per year2026
2026: 301,413 ha ▲ 221% above average
Largest fire Burgohondo fire, July 2026 · 63,974 ha -
536fires with a page1.1 Mha on pages2025Worst year2016ha burned per year2026
2026: 96,234 ha ▲ 21% above average
Largest fire Bosso fire, 11 October 2018 · 22,697 ha -
131fires with a page1.1 Mha on pages2017Worst year2016ha burned per year2026
2026: 140,334 ha ▼ 42% below average
Largest fire Xalx gol fire, 8 October 2026 · 140,547 ha -
1,576fires with a page888 kha on pages2021Worst year2016ha burned per year2026
2026: 63,152 ha ▲ 22% above average
Largest fire Manavgat fire, July 2021 · 54,769 ha -
1,041fires with a page858 kha on pages2021Worst year2016ha burned per year2026
2026: 353,520 ha
Largest fire Chekfa fire, August 2026 · 48,071 ha -
453fires with a page802 kha on pages2022Worst year2016ha burned per year2026
2026: 387,336 ha ▼ 53% below average
Largest fire Tahuamanu fire, 10 August 2024 · 22,349 ha -
349fires with a page772 kha on pages2020Worst year2016ha burned per year2026
2026: 107,167 ha ▼ 62% below average
Largest fire Isiolo South fire, 15 January 2025 · 28,977 ha -
164fires with a page763 kha on pages2016Worst year2016ha burned per year2026
2026: 156,365 ha ▼ 73% below average
Largest fire Rapti Sonari fire, March 2016 · 43,780 ha -
355fires with a page741 kha on pages2023Worst year2016ha burned per year2026
2026: 206,703 ha ▼ 53% below average
Largest fire Municipio San José de Bocay fire, 12 April 2024 · 42,436 ha -
399fires with a page733 kha on pages2019Worst year2016ha burned per year2026
2026: 170,428 ha ▼ 72% below average
Largest fire Voinjama fire, 1 April 2026 · 22,988 ha -
364fires with a page672 kha on pages2016Worst year2016ha burned per year2026
2026: 208,905 ha ▼ 34% below average
Largest fire Amou fire, January 2026 · 38,183 ha -
1,932fires with a page648 kha on pages2021Worst year2016ha burned per year2026
2026: 117,295 ha ▲ 107% above average
Largest fire Montiferru fire, July 2021 · 13,278 ha -
367fires with a page638 kha on pages2016Worst year2016ha burned per year2026
2026: 312,970 ha ▼ 59% below average
Largest fire Tan Hung fire, 4 April 2026 · 14,282 ha -
349fires with a page523 kha on pages2023Worst year2016ha burned per year2026
2026: 35,321 ha ▼ 29% below average
Largest fire Alexandroupolis fire, August 2023 · 96,610 ha -
334fires with a page522 kha on pages2020Worst year2016ha burned per year2026
2026: 199,107 ha ▼ 49% below average
Largest fire Cacine fire, April 2016 · 9,566 ha -
914fires with a page501 kha on pages2020Worst year2016ha burned per year2026
2026: 80,716 ha
Largest fire Kupres (BiH) fire, September 2026 · 13,227 ha -
295fires with a page496 kha on pages2020Worst year2016ha burned per year2026
2026: 224,061 ha ▼ 48% below average
Largest fire San Juan y Martínez fire, April 2025 · 15,236 ha -
208fires with a page493 kha on pages2025Worst year2016ha burned per year2026
2026: 54,891 ha ▲ 57% above average
Largest fire Kankossa fire, 14 November 2025 · 23,660 ha -
292fires with a page490 kha on pages2024Worst year2016ha burned per year2026
2026: 177,617 ha ▼ 65% below average
Largest fire San Andrés fire, 3 April 2020 · 7,203 ha -
229fires with a page413 kha on pages2023Worst year2016ha burned per year2026
2026: 97,664 ha ▲ 1% above average
Largest fire Kiang West fire, 10 February 2022 · 10,788 ha -
223fires with a page382 kha on pages2019Worst year2016ha burned per year2026
2026: 113,135 ha ▼ 64% below average
Largest fire Al-Kahla fire, June 2018 · 13,270 ha -
142fires with a page374 kha on pages2016Worst year2016ha burned per year2026
2026: 57,996 ha ▼ 35% below average
Largest fire Isabela fire, March 2024 · 27,069 ha -
309fires with a page354 kha on pages2019Worst year2016ha burned per year2026
2026: 18,370 ha ▼ 77% below average
Largest fire Khojavend District fire, 19 June 2019 · 12,995 ha -
369fires with a page337 kha on pages2016Worst year2016ha burned per year2026
2026: 60,160 ha ▼ 61% below average
Largest fire Beaufort fire, 16 March 2016 · 8,047 ha -
302fires with a page309 kha on pages2019Worst year2016ha burned per year2026
2026: 804 ha
Largest fire As-Saan fire, 15 May 2019 · 23,331 ha -
130fires with a page281 kha on pages2024Worst year2016ha burned per year2026
2026: 104,193 ha ▼ 16% below average
Largest fire Mahaica-Berbice fire, 17 February 2024 · 15,351 ha -
128fires with a page267 kha on pages2016Worst year2016ha burned per year2026
2026: 98,211 ha ▲ 1% above average
Largest fire Carrillo fire, January 2026 · 15,880 ha -
396fires with a page266 kha on pages2019Worst year2016ha burned per year2026
2026: 13,880 ha ▼ 53% below average
Largest fire Dedoplis Tskaro fire, 4 August 2026 · 14,812 ha -
151fires with a page259 kha on pages2016Worst year2016ha burned per year2026
2026: 153,781 ha ▼ 58% below average
Largest fire Farashband fire, 27 June 2020 · 7,130 ha -
506fires with a page244 kha on pages2017Worst year2016ha burned per year2026
2026: 43,351 ha
Largest fire Nikšić Municipality fire, 24 August 2026 · 14,076 ha -
347fires with a page236 kha on pages2024Worst year2016ha burned per year2026
2026: 25,314 ha
Largest fire Negotino fire, 14 July 2024 · 13,335 ha -
480fires with a page230 kha on pages2025Worst year2016ha burned per year2026
2026: 24,684 ha
Largest fire Sarandë fire, 6 August 2025 · 12,229 ha -
297fires with a page205 kha on pages2022Worst year2016ha burned per year2026
2026: 98,523 ha ▲ 583% above average
Largest fire Saumos fire, July 2026 · 37,363 ha -
137fires with a page204 kha on pages2016Worst year2016ha burned per year2026
2026: 144,841 ha ▼ 25% below average
Largest fire Plateaux fire, 22 August 2025 · 3,382 ha -
117fires with a page188 kha on pages2016Worst year2016ha burned per year2026
2026: 247,081 ha ▲ 6% above average
Largest fire Itogon fire, 16 February 2019 · 7,081 ha -
302fires with a page185 kha on pages2017Worst year2016ha burned per year2026
2026: 21,134 ha ▲ 60% above average
Largest fire Dinara fire, April 2020 · 5,948 ha -
617fires with a page168 kha on pages2022Worst year2016ha burned per year2026
2026: 29,814 ha
Largest fire Lăpușnicel fire, 22 March 2022 · 2,705 ha -
103fires with a page163 kha on pages2021Worst year2016ha burned per year2026
2026: 85,903 ha ▼ 55% below average
Largest fire Jhang fire, 23 October 2025 · 5,595 ha -
108fires with a page154 kha on pages2025Worst year2016ha burned per year2026
2026: 3,045 ha ▼ 74% below average
Largest fire Uiseong-gun fire, 22 March 2025 · 28,524 ha -
86fires with a page153 kha on pages2019Worst year2016ha burned per year2026
2026: 41,570 ha ▼ 65% below average
Largest fire Cayo fire, 2 April 2020 · 9,170 ha -
305fires with a page141 kha on pages2024Worst year2016ha burned per year2026
2026: 8,811 ha ▼ 32% below average
Largest fire Svilengrad fire, 13 July 2024 · 8,124 ha -
257fires with a page134 kha on pages2022Worst year2016ha burned per year2026
2026: 15,887 ha ▲ 41% above average
Largest fire Aso fire, 11 March 2018 · 6,426 ha -
66fires with a page133 kha on pages2021Worst year2016ha burned per year2026
2026: 30,458 ha ▼ 66% below average
Largest fire Muynak fire, 29 May 2019 · 7,519 ha -
370fires with a page131 kha on pages2024Worst year2016ha burned per year2026
2026: 37,021 ha
Largest fire Deliblatska peščara fire, July 2026 · 15,656 ha -
63fires with a page117 kha on pages2024Worst year2016ha burned per year2026
2026: 40,918 ha ▲ 30% above average
Largest fire Groot Henar fire, 22 March 2024 · 5,270 ha -
238fires with a page115 kha on pages2019Worst year2016ha burned per year2026
2026: 18,849 ha ▼ 41% below average
Largest fire Ruapehu District fire, November 2025 · 4,084 ha -
75fires with a page115 kha on pages2019Worst year2016ha burned per year2026
2026: 22,303 ha ▼ 79% below average
Largest fire Maphalaleni fire, 19 July 2019 · 5,188 ha -
175fires with a page111 kha on pages2019Worst year2016ha burned per year2026
2026: 1,439 ha ▼ 87% below average
Largest fire Spitak fire, 22 November 2025 · 4,534 ha -
192fires with a page108 kha on pages2021Worst year2016ha burned per year2026
2026: 29,154 ha
Largest fire ساقية سيدي يوسف fire, July 2026 · 13,434 ha -
117fires with a page95 kha on pages2025Worst year2016ha burned per year2026
2026: 25,084 ha
Largest fire Dava fire, June 2025 · 9,809 ha -
43fires with a page84 kha on pages2020Worst year2016ha burned per year2026
2026: 10,627 ha ▼ 17% below average
Largest fire Omhajer fire, January 2019 · 7,691 ha -
39fires with a page83 kha on pages2016Worst year2016ha burned per year2026
2026: 10,183 ha ▼ 59% below average
Largest fire Kayonza fire, June 2024 · 6,714 ha -
26fires with a page77 kha on pages2023Worst year2016ha burned per year2026
2026: 33,480 ha ▼ 40% below average
Largest fire Pedernales fire, 10 January 2022 · 14,875 ha -
44fires with a page71 kha on pages2017Worst year2016ha burned per year2026
2026: 37,083 ha ▼ 39% below average
Largest fire Intipuca fire, March 2019 · 4,821 ha -
110fires with a page68 kha on pages2022Worst year2016ha burned per year2026
2026: 5,989 ha
Largest fire Larache fire, 13 July 2022 · 12,623 ha -
43fires with a page57 kha on pages2019Worst year2016ha burned per year2026
2026: 43,889 ha ▼ 64% below average
Largest fire Río de Jesús fire, March 2016 · 3,466 ha -
34fires with a page48 kha on pages2016Worst year2016ha burned per year2026
2026: 18,358 ha ▼ 68% below average
Largest fire Kigamba fire, June 2019 · 2,736 ha -
Largest fire Municipality of Leposaviq fire, August 2025 · 3,029 ha162fires with a page46 kha on pages—Worst year
-
8fires with a page38 kha on pages2020Worst year2016ha burned per year2026
2026: 13,807 ha ▼ 54% below average
Largest fire Young fire, December 2021 · 15,133 ha -
44fires with a page33 kha on pages2025Worst year2016ha burned per year2026
2026: 326 ha ▼ 86% below average
Largest fire Agios Therapon fire, July 2025 · 12,437 ha -
94fires with a page30 kha on pages2024Worst year2016ha burned per year2026
2026: 1,680 ha
Largest fire Jerusalem fire, August 2021 · 1,230 ha -
38fires with a page22 kha on pages2018Worst year2016ha burned per year2026
2026: 185 ha
Largest fire Härjedalen fire, 15 July 2018 · 3,825 ha -
49fires with a page15 kha on pages2025Worst year2016ha burned per year2026
2026: 3,277 ha
Largest fire Meißen fire, July 2025 · 2,060 ha -
31fires with a page14 kha on pages2017Worst year2016ha burned per year2026
2026: 2,953 ha
Largest fire Conamara South LEA-5 fire, 7 May 2017 · 3,865 ha -
69fires with a page14 kha on pages2024Worst year2016ha burned per year2026
2026: 6,528 ha
Largest fire Aley fire, October 2019 · 1,092 ha -
7fires with a page14 kha on pages2025Worst year2016ha burned per year2026
2026: 4,851 ha ▼ 38% below average
Largest fire Bahrah fire, June 2022 · 3,292 ha -
39fires with a page10 kha on pages2022Worst year2016ha burned per year2026
2026: 2,287 ha
Largest fire Tiszafnred fire, July 2022 · 740 ha -
8fires with a page10 kha on pages2019Worst year2016ha burned per year2026
2026: 4,933 ha ▼ 82% below average
Largest fire Menkhoaneng fire, August 2019 · 1,705 ha -
16fires with a page9,978ha on pages2018Worst year2016ha burned per year2026
2026: 1,995 ha ▼ 79% below average
Largest fire Moskva fire, September 2017 · 1,841 ha -
4fires with a page9,110ha on pages2023Worst year2016ha burned per year2026
2026: 6,490 ha ▼ 49% below average
Largest fire Croix des Bouquets fire, February 2023 · 3,498 ha -
34fires with a page7,756ha on pages2019Worst year2016ha burned per year2026
2026: 1,589 ha
Largest fire Sokndal nor fire, 23 April 2019 · 778 ha -
7fires with a page7,423ha on pages2020Worst year2016ha burned per year2026
2026: 1,458 ha
Largest fire gmina Goniądz fire, April 2020 · 5,290 ha -
2fires with a page5,541ha on pages2016Worst year2016ha burned per year2026
2026: 6,933 ha ▼ 52% below average
Largest fire Rafah fire, May 2022 · 4,157 ha -
7fires with a page5,086ha on pages2022Worst year2016ha burned per year2026
2026: 354 ha ▲ 11% above average
Largest fire Miren-Kostanjevica fire, July 2022 · 3,988 ha -
14fires with a page4,818ha on pages2025Worst year2016ha burned per year2026
2026: 628 ha
Largest fire Ramallah & Al Bireh fire, April 2025 · 1,639 ha -
6fires with a page4,377ha on pages2025Worst year2016ha burned per year2026
2026: 3,038 ha
Largest fire Baelen fire, August 2026 · 2,655 ha -
14fires with a page4,115ha on pages2020Worst year2016ha burned per year2026
2026: 0 ha
Largest fire Al Marj fire, June 2020 · 961 ha -
7fires with a page2,944ha on pages2018Worst year2016ha burned per year2026
2026: 318 ha
Largest fire Valdgales pag. fire, July 2018 · 1,483 ha -
4fires with a page2,285ha on pages2021Worst year2016ha burned per year2026
2026: 66 ha
Largest fire Kolari fire, August 2021 · 1,010 ha -
2fires with a page2,211ha on pages2016Worst year2016ha burned per year2026
2026: 2,608 ha ▼ 89% below average
Largest fire Afmadow fire, January 2019 · 1,166 ha -
8fires with a page1,904ha on pages2022Worst year2016ha burned per year2026
2026: 444 ha
Largest fire Zwettl-Niederösterreich fire, March 2022 · 565 ha -
8fires with a page1,770ha on pages2025Worst year2016ha burned per year2026
2026: 1,164 ha
Largest fire Zohorie (vojenske obvod) fire, July 2026 · 558 ha -
2fires with a page1,581ha on pages2022Worst year2016ha burned per year2026
2026: 41 ha
Largest fire Hrensko fire, July 2022 · 1,436 ha -
5fires with a page1,475ha on pages2020Worst year2016ha burned per year2026
2026: 635 ha
Largest fire Deurne fire, April 2020 · 649 ha -
1fires with a page1,180ha on pages2023Worst year2016ha burned per year2026
2026: 960 ha ▼ 72% below average
Largest fire Malabo fire, February 2024 · 1,180 ha -
1fires with a page1,013ha on pages2019Worst year2016ha burned per year2026
2026: 229 ha ▼ 84% below average
Largest fire Salinas fire, June 2026 · 1,013 ha -
2fires with a page347ha on pages2018Worst year2016ha burned per year2026
2026: 299 ha
Largest fire Kuusalu vald fire, April 2026 · 241 ha -
1fires with a page331ha on pages2018Worst year2016ha burned per year2026
2026: 70 ha
Largest fire Vejle fire, May 2018 · 331 ha -
1fires with a page198ha on pages2023Worst year2016ha burned per year2026
2026: 46 ha
Largest fire Jonavos rajono savivaldybė fire, May 2023 · 198 ha -
1fires with a page150ha on pages2022Worst year2016ha burned per year2026
2026: 0 ha
Largest fire Gambarogno fire, January 2022 · 150 ha -
0fires with a page0ha on pages2025Worst year2016ha burned per year2026
2026: 207 ha
No fire pages yet: no fire has passed the threshold.
-
0fires with a page0ha on pages2020Worst year2016ha burned per year2026
2026: 266 ha
No fire pages yet: no fire has passed the threshold.
-
0fires with a page0ha on pages2020Worst year2016ha burned per year2026
2026: 0 ha
No fire pages yet: no fire has passed the threshold.
-
0fires with a page0ha on pages2024Worst year2016ha burned per year2026
2026: 32 ha
No fire pages yet: no fire has passed the threshold.
-
0fires with a page0ha on pages2021Worst year2016ha burned per year2026
2026: 220 ha ▼ 70% below average
No fire pages yet: no fire has passed the threshold.
-
0fires with a page0ha on pages2020Worst year2016ha burned per year2026
2026: 0 ha ▼ 100% below average
No fire pages yet: no fire has passed the threshold.
-
0fires with a page0ha on pages2021Worst year2016ha burned per year2026
2026: 984 ha ▲ 28% above average
No fire pages yet: no fire has passed the threshold.












































































No country matches the search.